A decade of aviation brings some surprising changes
By Steve Creedy Mon Dec 30, 2019
The last 10 years have seen major changes in aviation as fuel-efficient, twin-engine aircraft sounded the death knell for jumbo jets, the Asia-Pacific became the world’s biggest aviation market and airlines squeezed more seats into aircraft.
Passengers benefited as fares remained at surprisingly affordable lows, business class seats hit new levels of comfort, WiFi became airborne and inflight entertainment offered ever more options.
The average return airfare (before surcharges and taxes) in 2020 is tipped to be $US293, or 64 percent below 1998 levels after adjusting for inflation.
READ our top 10 stories for 2019See our top 10 videos and pictures for 2019
As a result of the continued cheap fares, air travel has continued to grow and the number of city pairs is expected to top 23,000 in 2020 as passenger numbers hit 4.72 billion, almost double the 2010 numbers.
Offsetting this was the rise of annoying ancillary fees for previously included items such as checked baggage, the decline of economy class catering and the reduction in cattle class legroom to knee-crunching levels.
It was the decade that saw the low-cost sector consolidate its position and one in which the global airline industry moved into the black and remained there after years of losses.
Allegiances became more fluid as airlines moved beyond the major global alliances to make strategic deals and some names faded away.
Those who failed to make it through the decade included Thomas Cook, airberlin, NIKI, Germanwings, Transaero and Mexicana.
Photo: airberlin
Although weaker than first anticipated, the air transport industry’s expected 2019 global net profit of $US25.9 billion will be its 10th consecutive year in the black and it is forecast to stay there with an improved result of $US29.3 billion in 2020.
Airlines have also become more efficient with carbon emissions per passenger declining more than 50 percent since 1990.
Much of that improvement occurred in the last decade as the industry achieved an annual fuel efficiency improvement of 2.3 percent since 2009, or about 0.8 percentage points ahead of target.
Airlines have invested about $US1 trillion in new aircraft since 2009 and have been working in areas such as sustainable aviation fuels, more efficient flying and better ground operations.
Many are also reducing landfill and cutting back on single-use plastics.
The industry is confident it will cap net emissions from 2020 and plans to cut emissions to half 2005 levels by 2050.
A global carbon offsetting scheme known as CORSIA aims to ensure carbon-neutral growth on international flights from 2020 and raise about $US40 billion in climate financing.
Research into new technology continued during the decade with resurging interest in supersonic aircraft as well as electric or hybrid planes and new forms of transport such as aerial taxis.
The phenomenal growth of drones opened up new possibilities but also raised serious issues in terms of airport security and airspace safety.
Along with the wider global developments, however, there have also been a number of less obvious trends that the sharp-eyed information detectives at aviation data experts OAG have spotted.
India’s Indigo is nominated as the fastest-growing airline over the last decade with the number of seats operated soaring from 10.4 million to 88.8 million over the last decade.
South American airline group LATAM was ranked second as consolidation delivered 87 million seats in 2019, followed by Azul Airlines and then Vietnam Airlines, which grew from less than 700,000 seats to 28.5 million over 10 years.
US carriers remain the global heavyweights in terms of scheduled seats with American Airlines in 2019 replacing 2010's top dog, Delta Air Lines.
The 2010 top five pecking-order of Delta, Southwest, American, United and US Airways became American, Delta, Southwest, United and Ryanair in 2019.
The addition of Ryanair to the top five also underscores the growth of low-cost carriers in the last decade, with their global capacity share rising from 20 percent to 31 percent.
Notable growth in the Asia-pacific saw the LCC share rise from 13 percent to 29 percent, while it grew in Latin America from 24 percent to 37 percent.
The single biggest regional market for LCC’s in 2019 was the Asia-pacific with some 2.2 billion seats, according to OAG. It noted China has yet to fully embrace the trend.
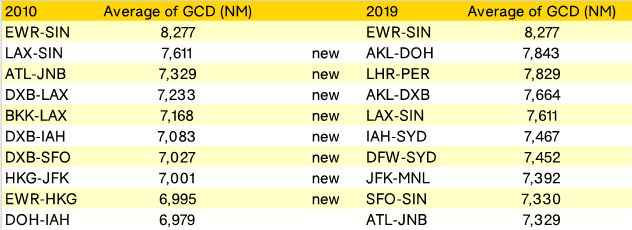
Another airline trend has been the emergence of new ultra-long-haul routes, with eight new city pairs joining the top 10 list.
New York-Singapore tops both the 2010 and 2019 lists but new entrants include Auckland-Doha, London-Perth, Auckland-Dubai, Los Angelese-Singapore and Houston Sydney.
OAG noted new aircraft such as the Airbus A350 and the Boeing 787 have allowed smaller, thinner markets to be served in this category.
Ultra-long-haul routes and how they've changed. Source: OAG
Most people would nominate China as the fastest growing market in the past decade but not when it comes to average annual growth rate.
Turkey is the surprising winner in that category thanks to the rapid emergence of low-cost carriers and an expanding national carrier.
Other growth areas include Vietnam, Peru, Ethiopia and Cambodia.
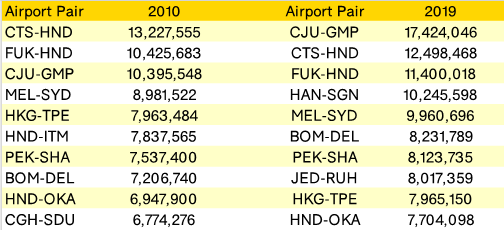
In terms of busy airport pairs, Hanoi-Ho chi Minh has soared from 465th to fourth over the past decade to beat Melbourne-Sydney on OAG’s 2019 league table.
Jeju-Gimpo in Korea remains the busiest airport pair followed by 2010’s number one, Chitose-Haneda, and Fukuoka-Haneda.
Busiest airport pairs in terms of seats. Source: OAG
“Perhaps just as interestingly no European or North American airport pair features in the global top ten which is dominated by services in Asia; confirming precisely where future market growth comes from in the next decade,’’ OAG noted.
In terms of scheduled seats, Hartsfield-Jackson Atlanta International Airport finished the decade as it began it as the world’s busiest airport but with 63.3 million scheduled seats in 2019 compared to 54.4 million in 2010.
Beijing capital was a close second with 62.7 million seats (Up from 47.4m) but OAG noted its growth will likely be crimped by the opening of Daxing.
Tokyo Haneda ranked third followed by Dubai, Los Angeles and Chicago O’Hare.
The OAG data sleuths noted that Tokyo Haneda will see a further 39,000 slots operating from April 2020 “which will potentially place the airport ahead of Atlanta”.
Dubai would continue to be the busiest international airport with the combined Emirates and Fly Dubai hubs continuing to develop, they added.
The types of planes we fly have also changed over the decade.
The OAG analysis of scheduled flights showed the A320 family in the decade had overtaken the Boeing 737 variants as the most heavily flown commercial aircraft.
It was the same situation when hours flown were considered, although the Boeing 777 passenger jet came in third and both the B787 and A350 featuring in the top 10.