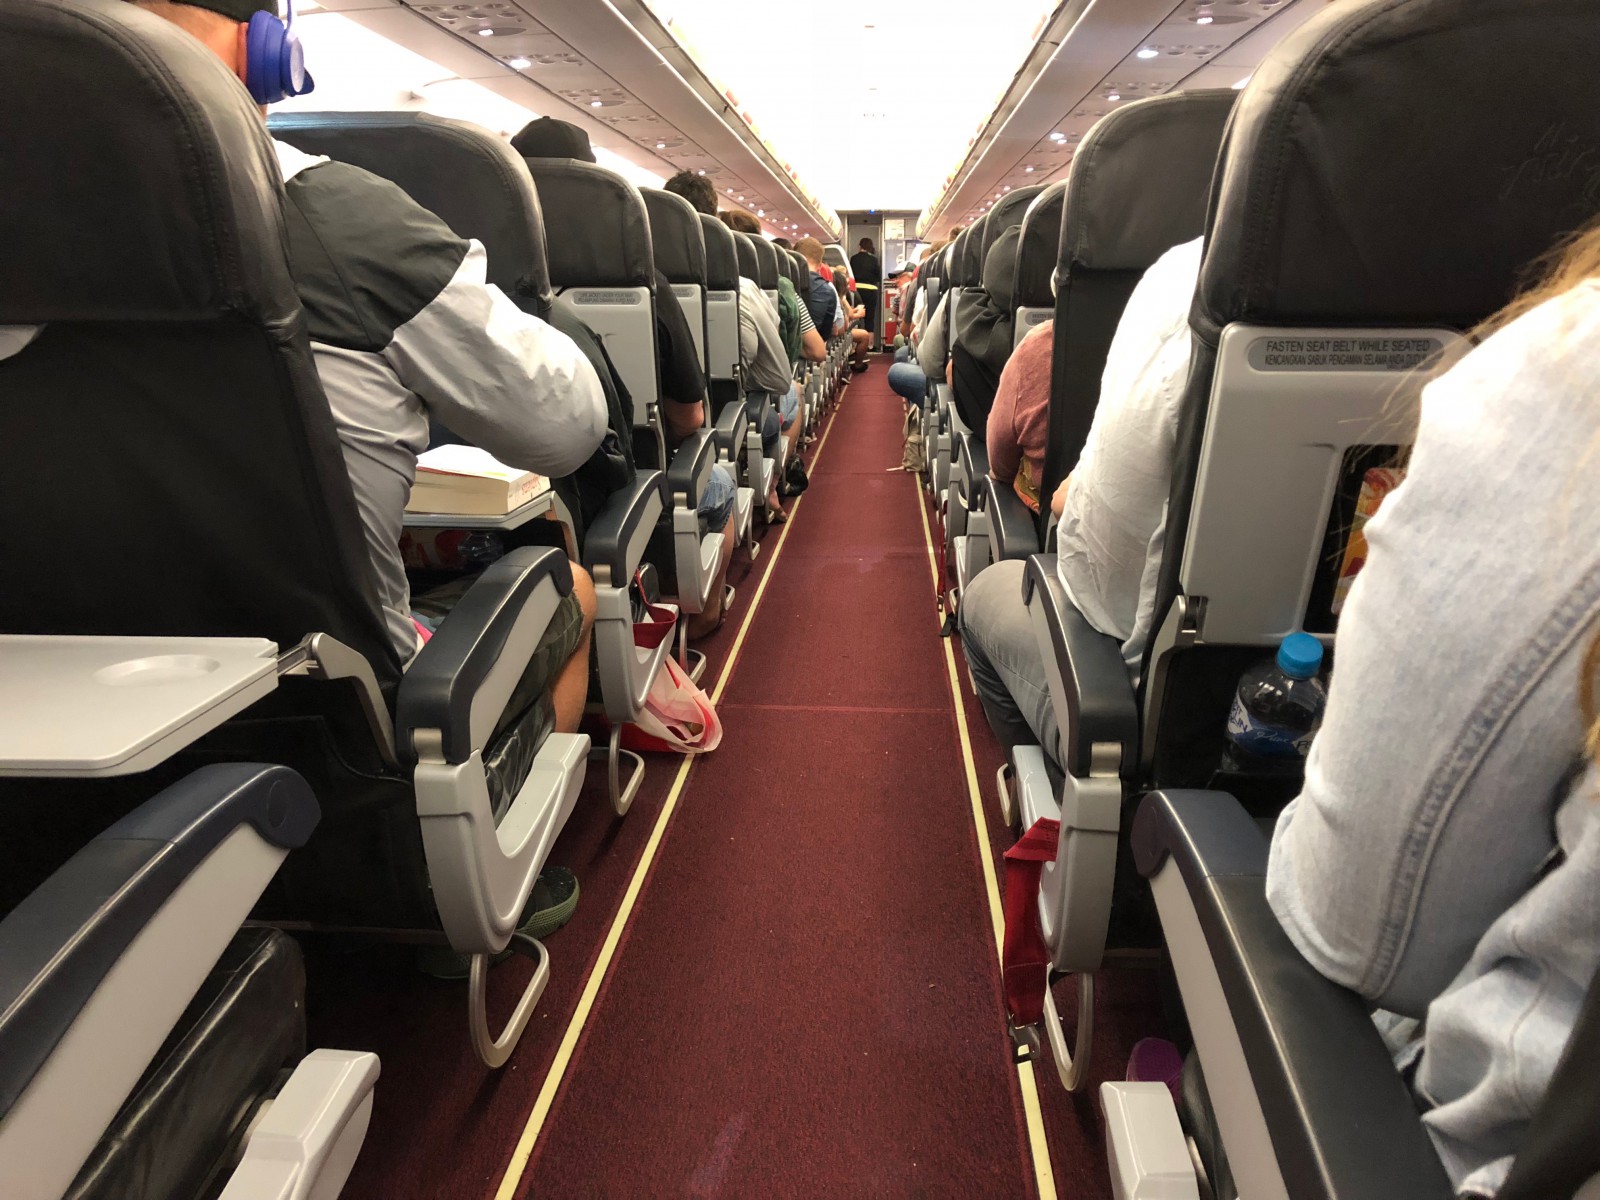
Airlines cram more passengers into planes

By Steve Creedy Thu Jul 4, 2019
Airlines globally are cramming more people into planes as they keep a tight rein on capacity in an environment where traffic growth remains below the long-term trend.
The global load factor rose 1.4 percentage points in May to a new record of 81.5 per cent as traffic grew by 4.5 per cent, a result still seen as solid but below the long-term average of 5.5 per cent.
So forget about a spare seat next to you on your next flight.
The growth in demand comes after year-on-year growth of 4.4 percent in April and a trough of 3.1 percent in March, according to figures released by the International Air Transport Association.
Domestic passengers face more crowding than their international counterparts with India and the US among the countries with high load factors.
READ: Virgin Australia, Virgin Atlantic get interim nod to deepen relationship
Global international traffic demand grew 4.3 per cent in May compared to a year ago while total capacity climbed 2.1 per cent to push up the load factor 1.7 percentage points to 80.4 per cent.
Domestic traffic grew 4.8 per cent globally, while capacity rose 3.8 per cent to push up loads by 0.8 percentage points to 83.4 per cent.
“Passenger demand growth has slowed compared to the past two years,'' said IATA director general Alexandre de Juniac.
"This is in line with slumping global trade, rising trade tensions and weakening business confidence.
In this challenging environment, airlines are managing capacity carefully in order to optimize efficiency.''
International traffic growth varied from region to region with European routes (84.2 per cent) and travellers to and from Latin America (84 per cent) seeing the highest load factors.
North American carriers came next with a load factor of 83.6 per cent followed by Asia-pacific carriers (78.6 per cent), Middle Eastern airlines (73 per cent) and those in Africa (67 per cent).
Load factors increased in all regions with the Middle East seeing the biggest rise of 5 percentage points.
Across a basket looking at domestic carriers in seven countries, Indian carriers posted the highest load factor at 90.1 percent followed by the US (86 per cent) and China (83.2 per cent).
Other results were Brazil (81.4 per cent), The Russian federations (80.1 per cent), Australia (77 per cent) and Japan (71.6 per cent).
Keeping planes full helps airlines boost fares or assists in preventing them from falling sharply in deteriorating economic conditions.
Airline yields reflect average fares and IATA reported that downward pressure on global base fare passenger yields -- those that excluded surcharges and the revenue that airlines generate from ancillary services -- persisted in March.
This is consistent with a squeeze in global profit margins that saw IATA in June lower its 2019 profit prediction for the industry.
Economy cabin yields remained under pressure with a fall of 0.6 per cent but those in the less price sensitive premium cabins rose by 1.2 per cent compared to the
prior month. This was the biggest increase since February 2018.
"Overall global average passenger yields in US dollar terms were 6.0 per cent lower compared to a year ago in March as airlines were not able to pass through cost increases
through higher base fares to customers,'' it said.
"As global economy growth forecasts are being revised down, industry-wide passenger yields are expected to remain under pressure."
Have questions or want to share your thoughts?